In the ever-evolving digital landscape, understanding how visitors interact with your website is crucial.
Are you able to see where users click most on your site?
Do you know which pages cause them to drop off?
Are you struggling to make data-driven decisions that can enhance user experience and boost conversions?
If these questions resonate with you, then Microsoft Clarity might be the tool you’ve been searching for.
In this blog, we’ll dive deep into everything you need to know about Microsoft Clarity: its features, integration, installation process, and why it stands out compared to other analytics tools like Google Analytics 4 (GA4) and Hotjar. Let’s get started!
Microsoft Clarity is a free, user-behaviour analytics tool that helps you understand how people navigate and interact with your website. It provid es visual insights through heatmaps, session recordings, and more, allowing you to see exactly what users do on your site. This data-driven approach can help you make informed decisions to improve user experience, enhance marketing efforts, and optimize your website for better performance.
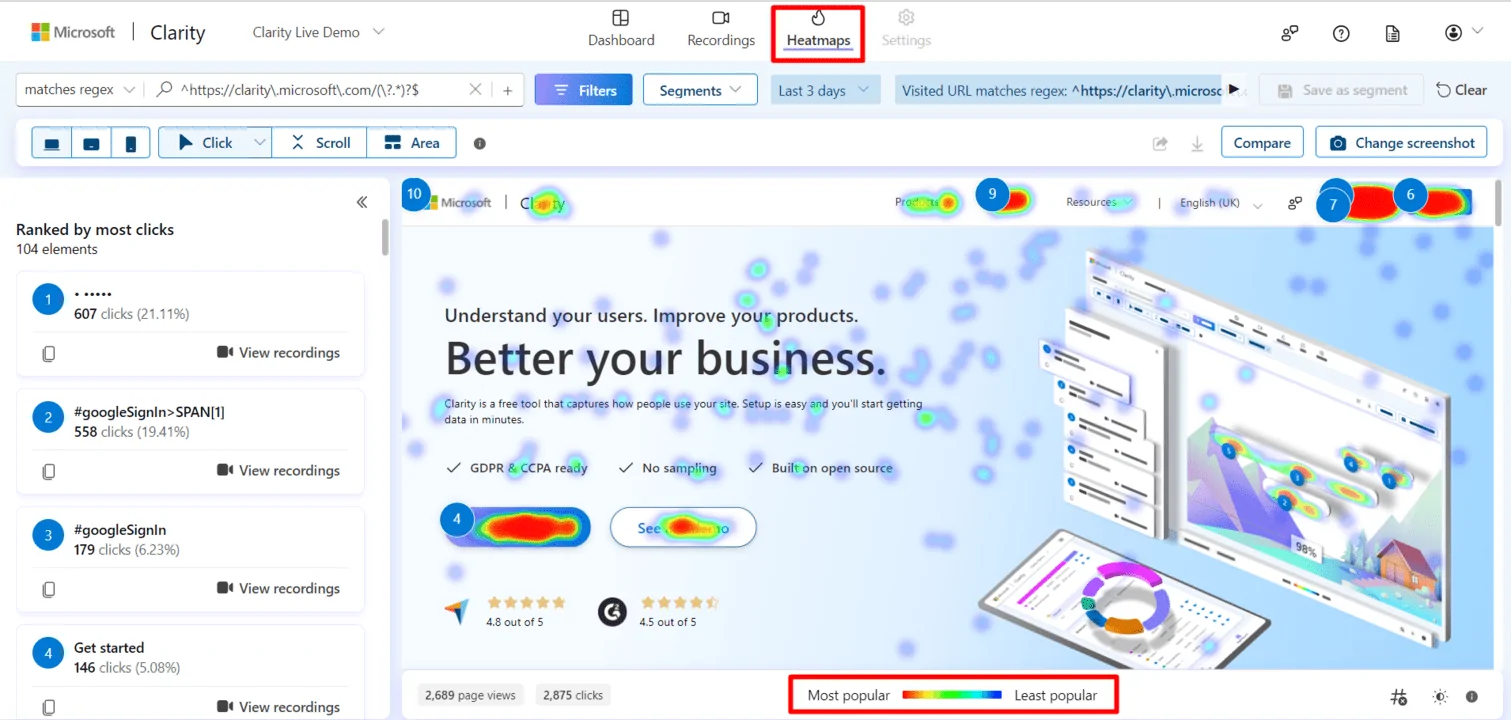
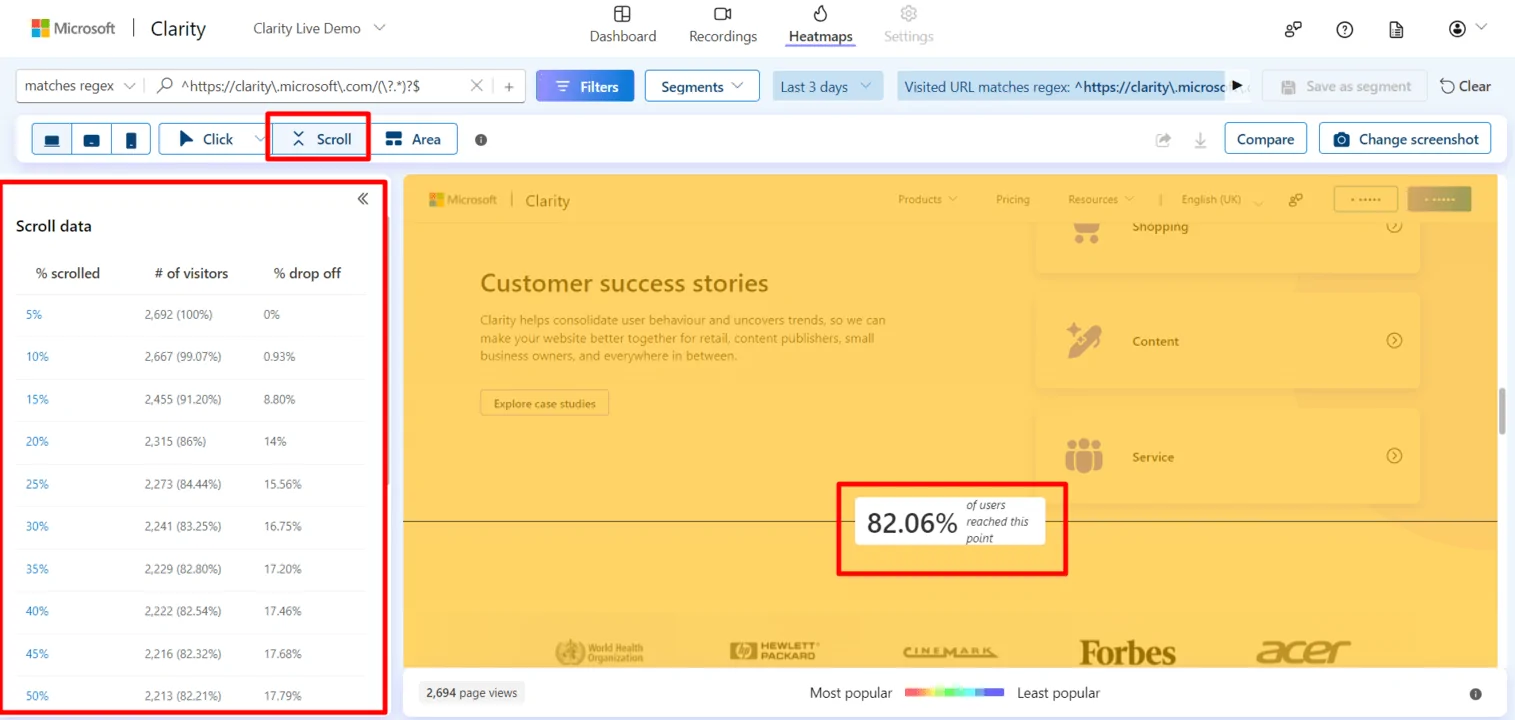
Microsoft Clarity’s heatmaps are powerful visualization tools that highlight the most interacted areas on your webpage using warm colours like red and yellow. They include Click Heatmaps to reveal the most engaging parts of your site, Scroll Heatmaps to show how far users scroll, and Movement Heatmaps to track mouse movements, helping you understand navigation patterns and improve your site layout.
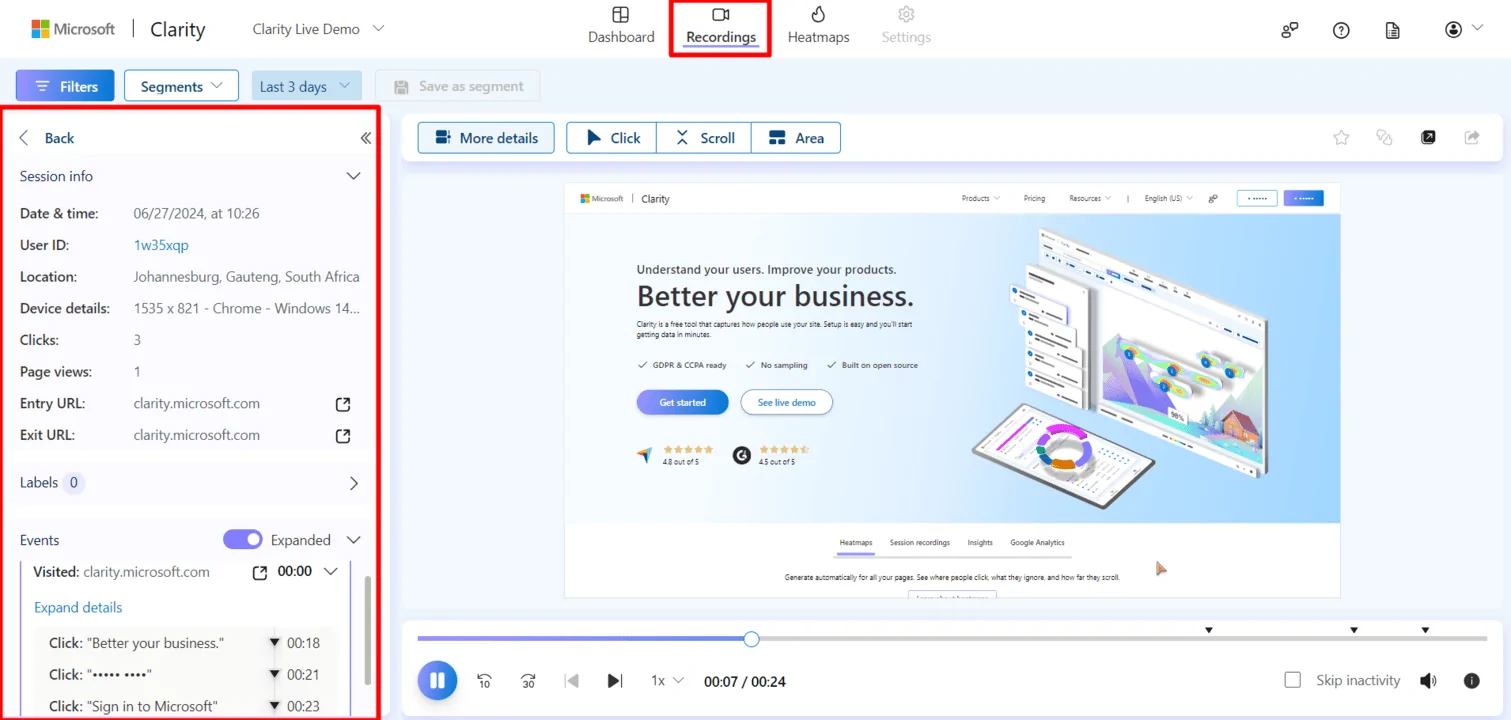
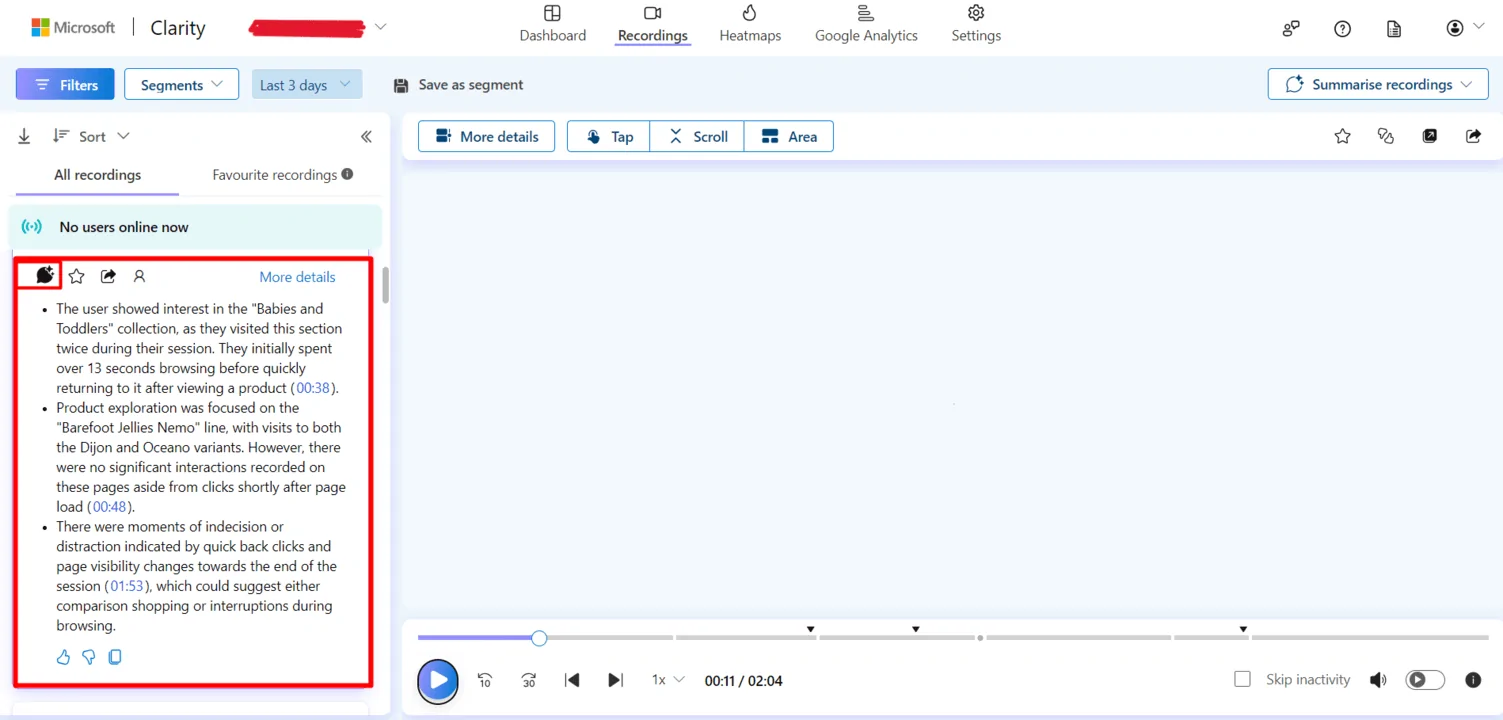
With Clarity’s session recordings, you can capture videos of user interactions, including clicks and movements. This feature helps identify issues and improve user experience. Watch User Sessions to observe navigation, use Live Session Recordings for real-time adjustments, and leverage Co-Pilot Summaries to highlight trends without watching each session individually
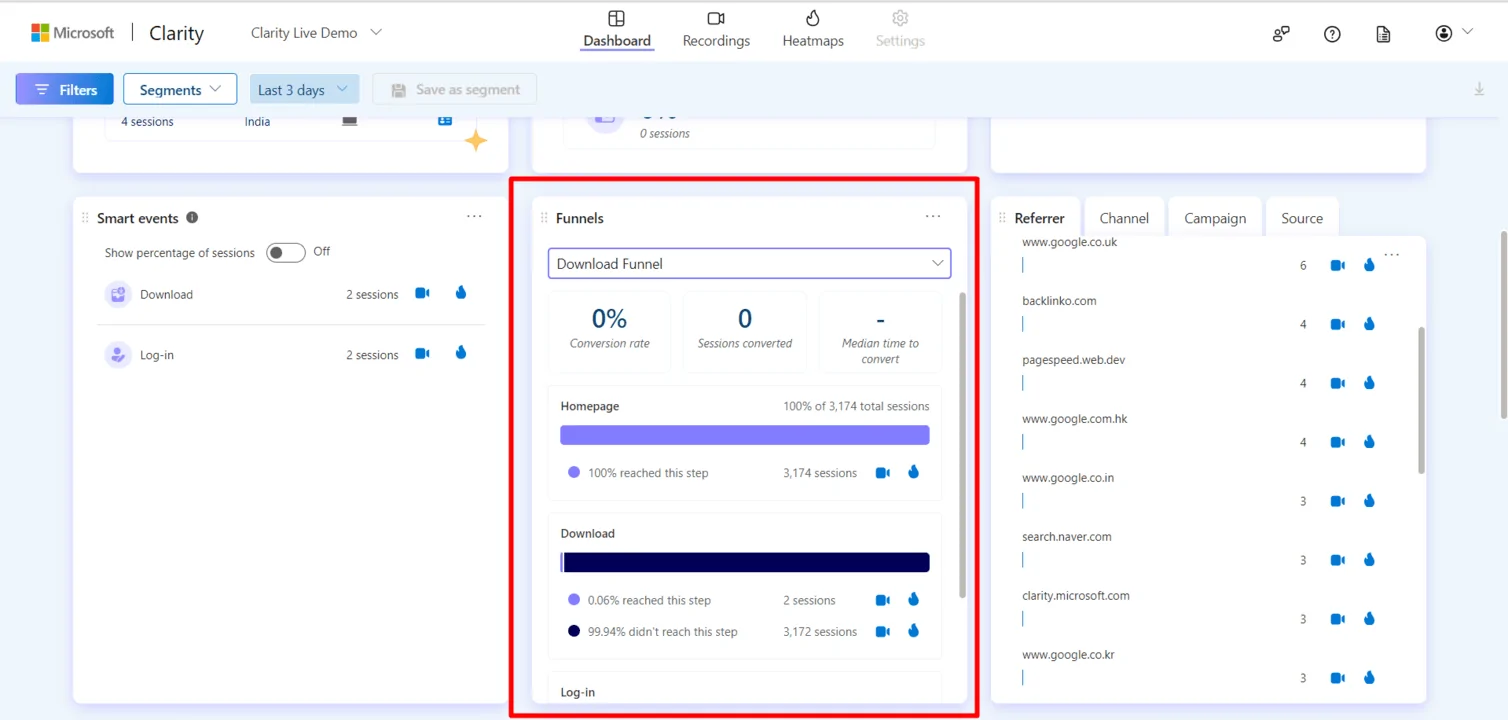
Clarity’s funnel analysis tracks the steps users take to complete specific goals, such as checkouts or sign-ups, identifying where they drop off. It includes Conversion Funnels to monitor user flow and Step-by-Step Analysis to pinpoint stages needing improvement, optimizing these processes for higher conversion rates.
Clarity’s user paths feature provides visual representations of the route’s users take through your website, showing the sequence of pages they visit. Analyze Navigation Paths to identify common routes and optimize site structure and use Path Visualization to see user transitions from one page to another, enhancing the user journey.
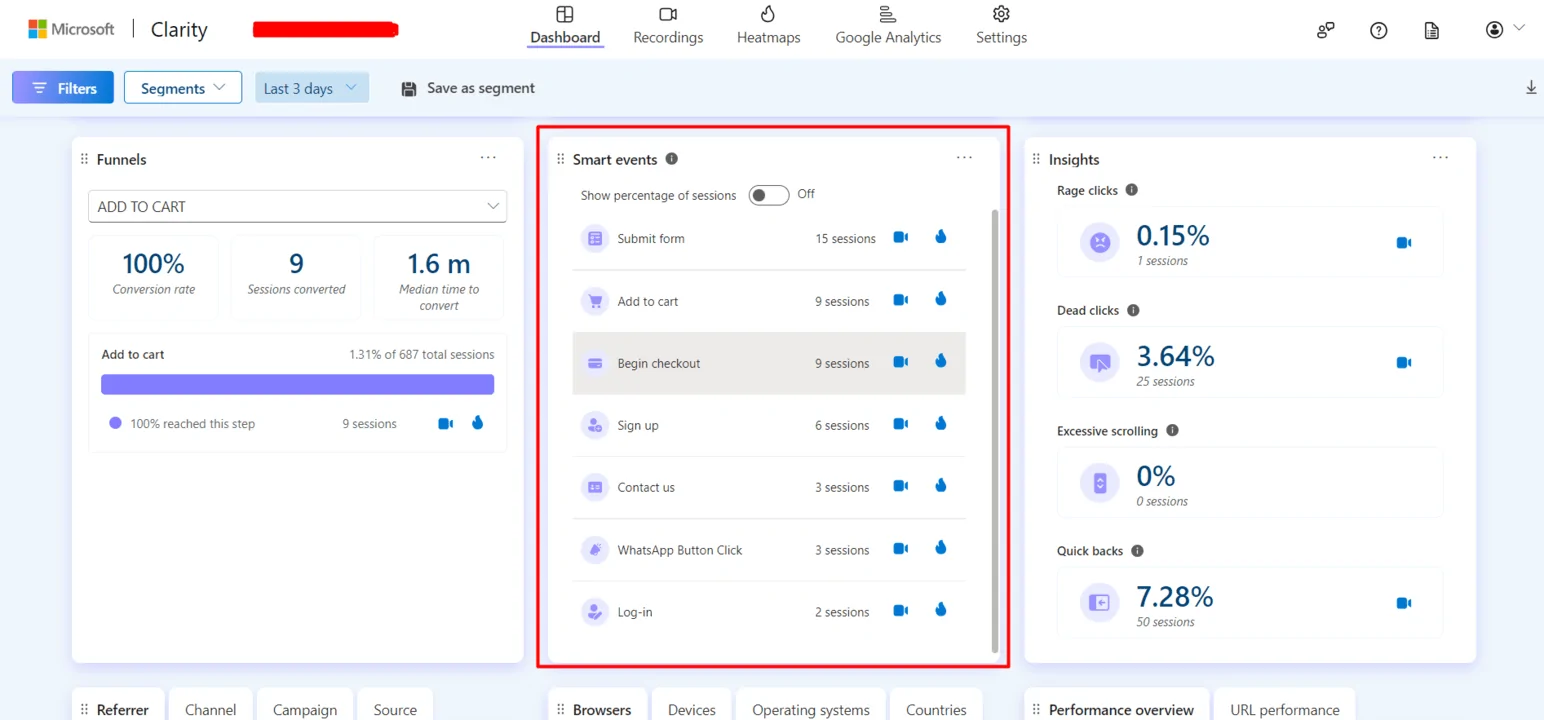
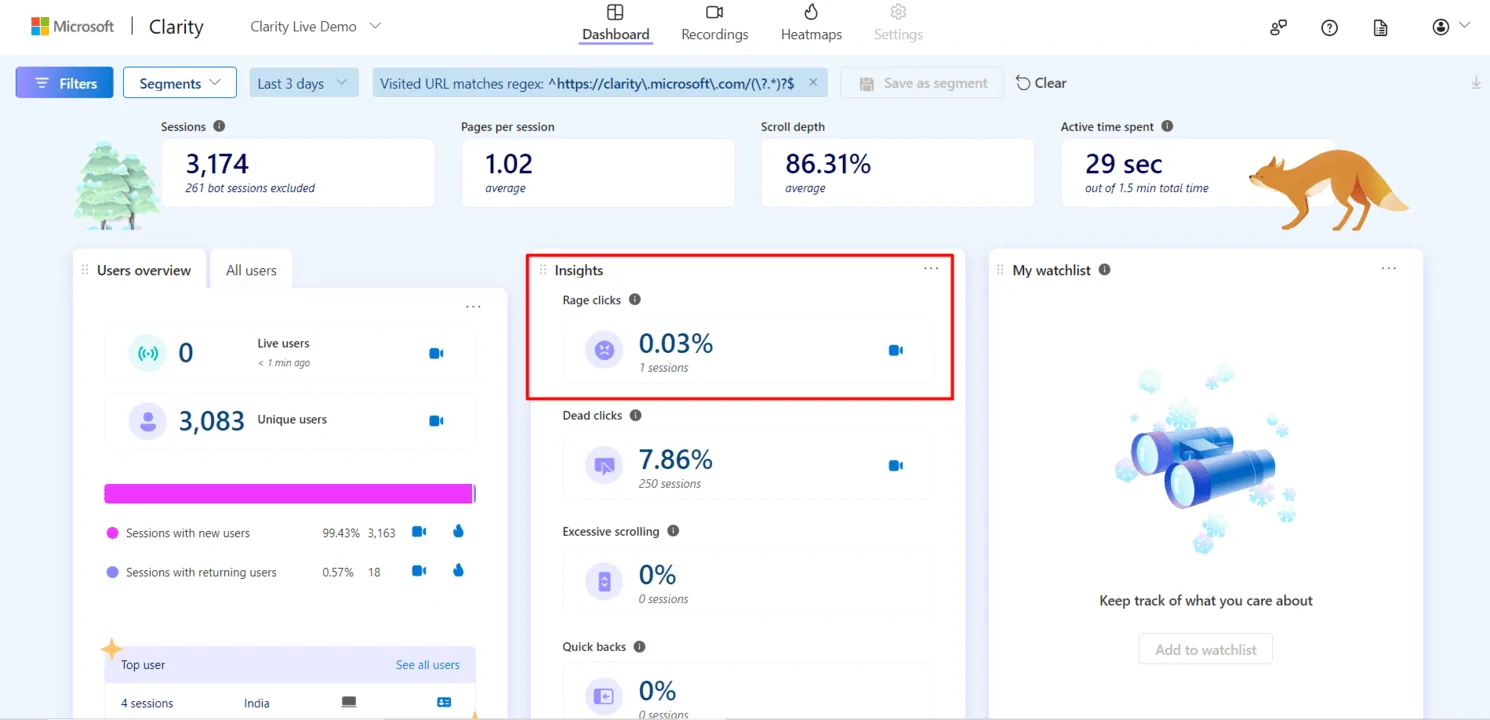
Microsoft Clarity’s smart events automatically track important user actions on your website, making data analysis easy without coding. These include User Defined Events for custom actions like form submissions, and Auto Smart Events that detect actions like rage clicks, dead clicks, and excessive scrolling, highlighting potential usability issues.
Clarity’s scroll data provides metrics on how users interact with your webpage by scrolling, helping optimize content placement and user engagement. It includes Scroll Depth to understand content engagement, Scroll Activity to identify areas of interest, and Scroll Velocity to gain insights into engagement levels and interaction patterns.
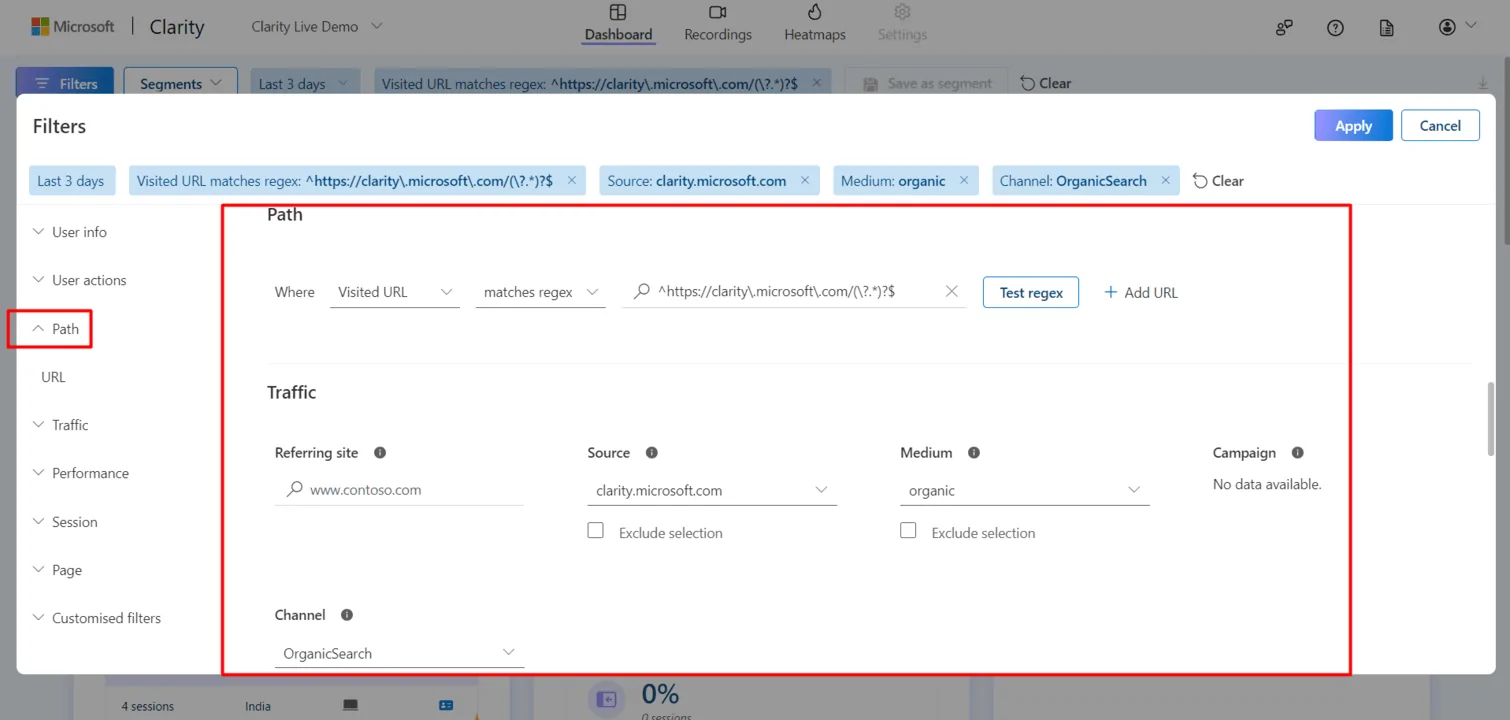
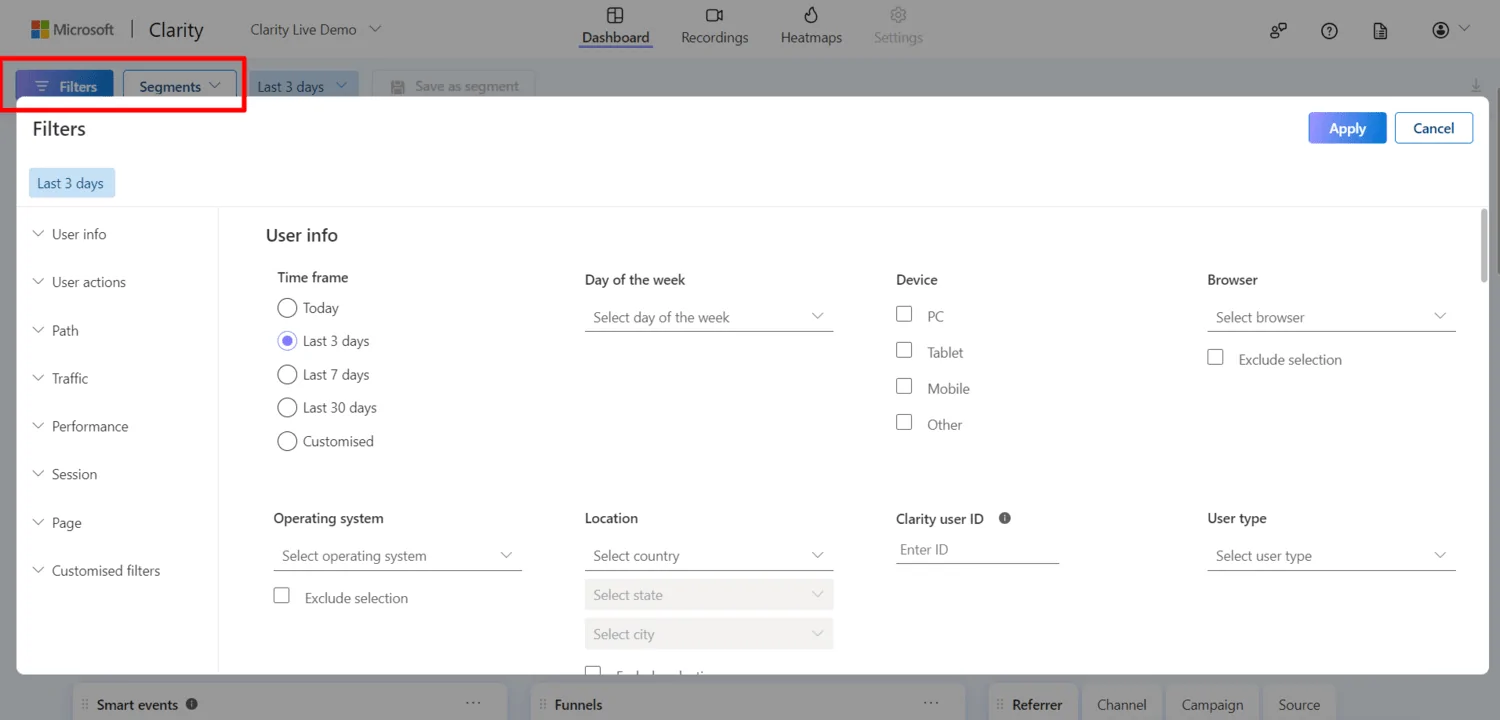
Microsoft Clarity allows for deep insights into user behaviour and performance metrics through segmenting and filtering views. Segmenting divides data into groups based on criteria like demographics or actions, while filtering narrows down data to subsets meeting predefined criteria, such as time periods or device types, enabling more informed decision-making and strategy optimization.
It leverages advanced analytics and artificial intelligence to assist Microsoft Clarity users in understanding and improving their digital experiences. These features often include providing actionable insights and recommendations based on data analysis, such as identifying usability issues, suggesting optimizations for conversion funnels, or highlighting trends in user behaviour.
In Clarity, “rage clicks” refer to instances where users repeatedly click on the same element or area of a webpage within a short period. These clicks often indicate frustration or confusion, suggesting potential usability issues that need attention from website owners or developers. Clarity detects and highlights rage clicks to help identify problematic areas on the website, allowing for improvements to enhance user experience and reduce user frustration.
Getting started with Microsoft Clarity is straightforward. Here’s a step-by-step guide to installing and integrating it with your website:
For a detailed installation guide click here.
Free with unlimited heatmaps and session recordings.
Focuses on user behaviour with features like heatmaps, session recordings, and rage clicks.
Integrates well with Google Analytics, Google Tag Manager, and more.
Provides detailed user behaviour insights through heatmaps, session recordings, and rage clicks.
Free, but session recordings and heatmaps are not included.
Comprehensive analytics tool focusing on website traffic, user demographics, and performance metrics.
Integrates seamlessly with other Google products and many third-party tools.
Focuses on traffic and performance metrics, lacking native heatmaps and session recordings.
Offers free and paid plans, with limitations on the number of recordings and heatmaps in the free version.
Combines user behaviour analytics with feedback tools like surveys and polls.
Offers a broad range of integrations, including CMS platforms, CRM systems, and more.
Combines user behaviour insights with feedback tools for a more comprehensive analysis.
While Clarity excels in visualizing user interactions, it lacks some traffic and demographic analysis features found in GA4. However, Clarity can integrate with GA4 to provide a comprehensive analysis by combining Clarity’s user behaviour insights with GA4’s traffic and demographic data.
Microsoft Clarity is a powerful, free tool that provides invaluable insights into user behaviour on your website. Whether you’re looking to improve user experience, optimize marketing efforts, or make informed product development decisions, Clarity offers the features you need to succeed.
Do you also want to analyze your users’ data and transform your approach to data analysis and decision-making? Start using Microsoft Clarity today. For more detailed insights and a step-by-step WhatsApp or Schedule a call with our experts at Technoid FZE to streamline your Microsoft Clarity setup.
In Summary This article highlights the top 10 website development companies in Dubai Silicon Oa ..
Is your business missing from the online world? If so, you may be missing out on valuable oppor ..
Do you ever find yourself scrolling through your social media feed or searching on Google, only ..
[calendly url=”https://calendly.com/technoidfze/30min” type=”1″]

